
The Class Dashboard
This week, Adam Catchpole delivered an insightful presentation to Cranbrook School teachers on The Class Dashboard, a powerful tool that’s transforming the way we understand and support our students.
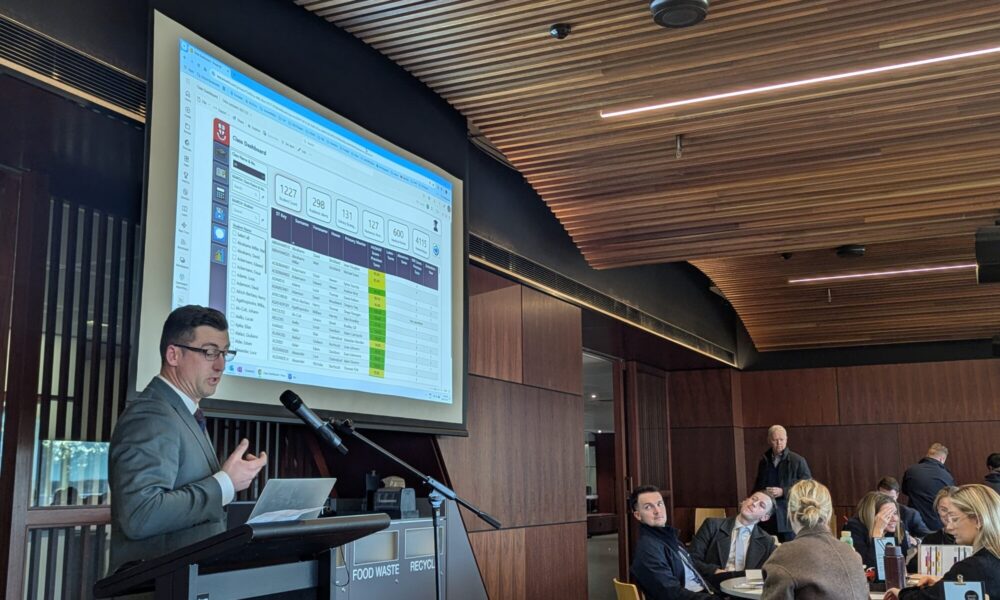
Built using Power BI, the Class Dashboard organises key data sets by class, giving teachers a clear, accessible overview of the students they teach. It tracks individual student data on absences, merits, detentions, and each student’s attitude and effort score each term. With just one click, teachers can explore these insights in greater depth, enabling timely, specific conversations that support both learning and wellbeing.
Crucially, the dashboard also provides teachers with an overview of students’ learning needs and the adjustments required to support them, helping to inform differentiated instruction. It also features targeted literacy and numeracy strategies that have been recommended for specific students, allowing teachers to plan more responsively and effectively.
Adam’s presentation guided teachers through the dashboard’s key features and functionality, highlighting how it can be used day to day to support learning. He also shared valuable examples of how he has used the tool himself to inform personalised, evidence-based conversations with students, bringing data to life in meaningful, relational ways.
The Class Dashboard complements the Student Dashboard, also developed by Adam in Power BI, which draws together academic, wellbeing, and co-curricular data to help staff monitor trends and respond proactively.
Together, these tools represent more than just efficient data management — they signal a broader cultural shift. Cranbrook teachers have always been deeply committed to understanding each student as a whole person; now, we have tools that help us do so with even greater precision, insight, and empathy.
Hannah Thomas
Director of Professional Learning